Australian property values rose again in August but the boom is losing steam – new figures show it is the lowest monthly rise since January – as affordability, rather than disruption from lockdowns, takes its toll on the market.
CoreLogic’s latest national Home Value Index showed property values had recorded their fastest annual growth since 1989 – up 15.8 per cent from the start of the year and 18.4 per cent higher than a year ago.
That equates to $103,400, or $1990 per week.
Australian wages rose at an average rate of 1.7 per cent, in comparison with property prices which grew almost 11 times faster than wages in the past year alone.
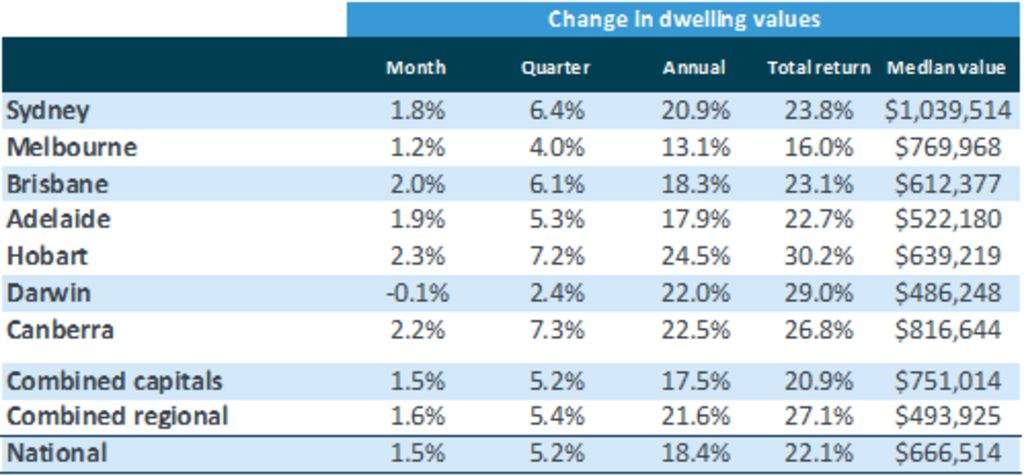
But the pace of growth has continued to lose steam, with national home values up 1.5 per cent to $666,514 in August, the lowest monthly rise since January.

CoreLogic Home Value Index August 2021. Photo: CoreLogic
Every capital city recorded a rise in property values, apart from Darwin (-0.1 per cent) in August.
Hobart recorded the strongest jump of 2.3 per cent in the past month to a median of $639,219.
It was followed by Canberra, where home values rose 2.2 per cent to $816,644 then Brisbane, where property prices increased 2 per cent to $612,377.
In Sydney property values rose 1.8 per cent to $1,039,514 while Melbourne rose 1.2 per cent to $769,968.
The rate of price growth has continued to moderate after reaching a peak in March this year, when values rose 2.8 per cent in a single month. This was led by Sydney, where property prices were up 3.7 per cent.
The narrowing price gap between houses and units, low listing numbers in the face of strong buyer demand, and price growth almost 11 times the annual average wages growth were all indicators that affordability was constraining the property market, said Eliza Owen, CoreLogic head of residential research.
“Social distancing restrictions don’t have as much of an impact on prices as they do on transaction activity,” Ms Owen said. “It’s more tied to affordability constraints and that is evidenced in the narrowing gap of houses and units.
“There are definitely signs there that there are demands for housing, and buyers are potentially looking for more affordable pockets of the market and that includes units.”
In the first quarter of the year, capital-city house values were rising about 1.1 percentage points faster than units each month. By August, that reduced to 0.7 percentage points.
The fact that house prices rose almost 11 times faster than wages growth in the past year was another reason the property boom had begun to lose steam, Ms Owen said.
“That creates a more significant barrier to entry, particularly for those who don’t own a home, because they don’t see the same appreciation and wealth growth as those who own property.”
While lockdowns were having a clear impact on consumer sentiment, she said, it had not yet translated to big price growth falls, with plenty of buyers left in the market.
The impact had instead been seen more by sellers. There had been a fall in advertised listings and, to a lesser extent, fewer home sales, which was central to holding up property prices, Ms Owen said.
“We’ve seen almost 160,000 sales in Australia over the past three months compared to 111,000 new listings added to the market,” Ms Owen said.
“There are still far more sales happening for every new property that is being advertised and that is contributing to the sense of urgency and the uplift in prices that we’re seeing around the country.”
In early May, newly advertised properties were tracking 19.7 per cent above the five-year average. By August, the monthly number of new listingsdropped 5.8 per cent below the five-year average and total active listings were down 29.4 per cent below the average, due to the lockdowns and season factors, CoreLogic found.
Sourced from Domain.com.au
in Latest News
Share This Post
Categories
Archived Posts
- February 2024 (1)
- January 2024 (2)
- October 2023 (2)
- September 2023 (1)
- August 2023 (3)
- July 2023 (2)
- September 2021 (1)
- August 2021 (3)
- November 2019 (1)
- October 2019 (4)
- February 2018 (1)
- January 2018 (1)
- December 2017 (3)
- November 2017 (1)
- October 2017 (2)
- September 2017 (4)
- August 2017 (4)
- July 2017 (2)
- June 2017 (1)
- May 2017 (1)
- April 2017 (1)
- March 2017 (1)
- February 2017 (1)
- January 2017 (2)
- December 2016 (2)
- November 2016 (1)
- September 2016 (1)
- July 2016 (1)
